Cases
Read how it goes in practice: our clients' stories, from first conversation to numbers everyone trusts.

Read how it goes in practice: our clients' stories, from first conversation to numbers everyone trusts.
Optitrade Retailgroep works in the optical and hearing-care trade, in wholesale and retail. Three kinds of reader rely on the sales figures: the company itself, its affiliated suppliers and its customers. All three want to know something different. Every question used to get its own report. Now it all comes out of one model and every reader sees exactly the part they need.
The sticking point was not the number of reports. It was that each report brought its own definition. Revenue, margin and volumes were worked out again per report, so the number a supplier saw did not have to match the number the company steered on. Differences like that usually only come up once a decision hangs on them.
So there is now one model under all sales reporting, with revenue, margin and volumes set down once. You can look at them per product group, per private label, per customer group or from whatever other angle the company uses. The reporting sits on top of that per reader, with access to exactly the part they need. The model draws on a number of systems and is used by colleagues across departments and by five to ten suppliers and customers from outside.
A supplier and the company now look at the same figure, just at a different slice of it. And a new angle has become a question to the model rather than a new report with a new definition.

Optitrade Retailgroep
Pim Föster, Director Retail Consultancy & Optitrade
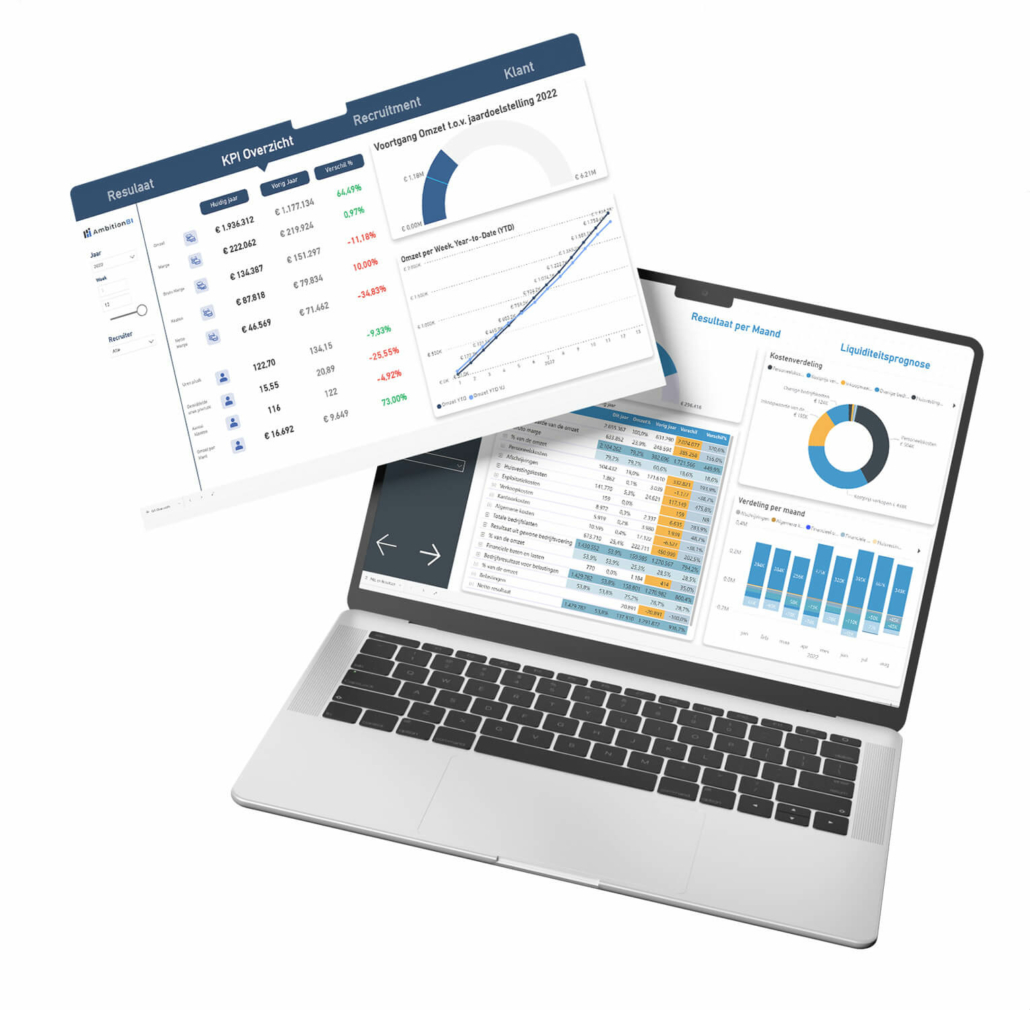
Perspectief Psychologenpraktijk treats adults and children at locations in Culemborg, Giessenburg, Gorinchem and Leerdam. For the management meeting there was a reporting process the back office spent time on every period. Those figures now come together automatically in one report, with the main KPIs side by side across several dimensions and the figures behind them one click away.
The finance director's question was a practical one: give the back office and HR operational insight without them having to build it themselves every period. What a practice steers on is a short list: revenue, productivity and how practitioners are deployed. Those figures sat in the client system, the HR system and a number of lists with targets and budgets. The model brings them together.
The practice also has two parts that work differently. Adult care is reimbursed by the health insurer, child and youth care by the municipality. The practice looks at them differently and works out productivity differently. We wrote those two calculations down together with the practice and fixed them in the model, so it works them out itself and each part sits in the report in its own way.
What is in place now: the back office keeps an eye on the processes and keeps the master data clean. The time that used to go to building reports now goes to steering and to the operation. The management meeting looks at the same figures every week. The main KPIs can be viewed per location, per part of the practice and per period. Whoever sees a number that raises a question zooms in on the figures behind it. A new question has become a click in the report.
Perspectief Psychologenpraktijk
Jan Glimmerveen, finance director
At Boskalis hundreds of finance staff work with the same numbers, spread across countries and business units. The financial data model underneath was designed and set up by us, put in place together with the Boskalis team and improved continuously since. 150 to 200 finance staff work with it every day.
At that size the question is not whether somebody can build a report. It is whether two hundred people mean the same thing by what they report. Every angle, from a project controller to reporting on the whole group, wants different cuts of the same figures.
The ordering belongs in the model, then, because every report that brings its own logic grows into its own version of the truth. So that model was designed and built on the ERP, with the consolidation tool alongside it adding up every part of the business. The reporting was built on that: from the classic financial statements to the reporting on what is outstanding with customers and suppliers.
What stands there carries the finance function within the company. Anyone with a new reporting question builds it on the model that is already in place.

Boskalis
Pieter Klem, Manager Business Intelligence
In healthcare, wholesale, maritime, automotive, telecom, industry, real estate and private equity. Some as an engagement, some as interim. What they share is not the sector but the moment: the numbers sat across too many systems to risk a decision on them.










Every one of these started with a single call in which somebody explained what was not adding up. We are glad to have that call with you too.

We bring the numbers from all your systems together in one data model. Your reporting adds up and everyone works from the same figures.

